Soils in downtown Sydney behave quite differently from those found up in the Margaree Valley. Sydney's historical infill, often layered with coal mine tailings and silty sands, demands a completely different classification approach than the dense, boulder-rich glacial tills that dominate the Highlands. On the coast, marine silts can hold fines that a standard sieve stack would miss entirely, which is why a combined sieve and hydrometer analysis becomes non-negotiable for anyone designing foundations or earthworks in Cape Breton. Without this comprehensive grain size analysis, the true nature of the material—especially the clay fraction and its potential for water retention—remains hidden. We run the full procedure on every sample, pairing mechanical shaking with sedimentation testing to build a complete particle-size distribution curve that holds up under the scrutiny of NBCC and ASTM standards.
In Cape Breton's glacial and coastal deposits, the hydrometer test is not optional—it is the only way to measure the clay fraction that controls drainage and frost susceptibility.
Process and scope
Local considerations
We often see reports from Cape Breton projects where the grain size analysis stopped at the No. 200 sieve, leaving the hydrometer portion undone. This shortcut becomes a liability when the soil contains even 5% active clay—just enough to cause frost heave in pavement subgrades or unexpected settlement under shallow footings. Without the full sedimentation curve, a silty sand can be mistaken for clean sand, and a foundation designed on that assumption may require costly remediation within the first winter cycle. The clay fraction also directly influences the soil's response during excavation and slope cutting; a material with 12% clay will stand up differently than one with 2%, even if the sieve fractions look identical. In a region where freeze-thaw cycles are aggressive, the hydrometer data is what separates a durable design from a seasonal failure.
Applicable standards
The relevant standards include ASTM D422-63 (Reapproved
Related services
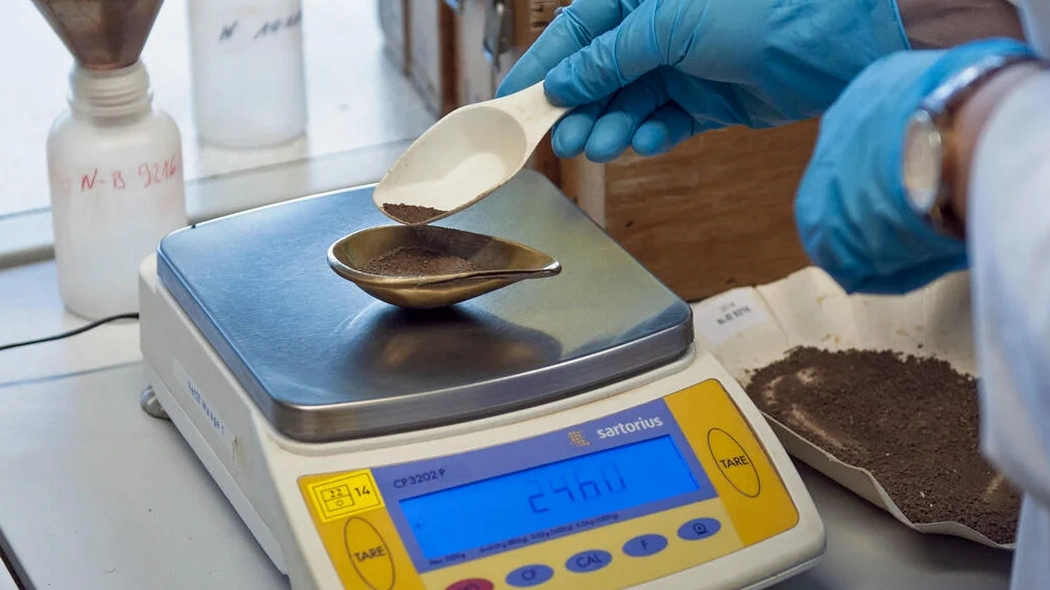
Combined Sieve and Hydrometer Analysis
The full ASTM D422 and D6913 package for samples requiring fines quantification. Includes washing over No. 200 sieve, mechanical shaking of the coarse fraction, and hydrometer sedimentation of the fine fraction with temperature-corrected readings at 0.5, 1, 2, 5, 15, 30, 60, 250, and 1440 minutes.
Wash Sieve Only (Fines Content Determination)
For granular materials where only the percentage passing the 75 µm sieve is needed. The sample is washed, dried, and the mass loss reported as fines content. Useful for aggregate compliance checks and preliminary soil classification.
Gradation Curve and Soil Classification Report
A complete engineering report with semi-log gradation plot, calculated D10, D30, D60, uniformity coefficient (Cu), coefficient of curvature (Cc), and USCS classification. Delivered in PDF and spreadsheet format for direct import into geotechnical design software.
Typical parameters
Questions and answers
What is the difference between a sieve analysis and a hydrometer analysis?
A sieve analysis mechanically separates particles larger than 75 µm (retained on the No. 200 sieve) using a stack of sieves with progressively smaller openings. It gives the distribution of sand and gravel fractions. The hydrometer analysis measures the settlement rate of particles smaller than 75 µm suspended in a water column, using Stokes' law to calculate the equivalent particle diameter. Together, they produce a complete gradation curve from coarse gravel down to clay-sized particles.
How long does a combined sieve and hydrometer test take in the lab?
Mechanical sieving is typically completed within one working day. The hydrometer phase requires a minimum of 24 hours of sedimentation readings, and in some cases extends to 48 hours to capture the finest clay fraction. Including sample preparation, oven-drying, washing, and reporting, the full combined analysis is generally delivered within three to four business days.
What does a grain size analysis cost in Cape Breton?
Which standard do you follow for hydrometer analysis?
We follow ASTM D422 for the hydrometer sedimentation procedure, with sample dispersion using sodium hexametaphosphate. For the sieve portion, we use ASTM D6913. The particle-size distribution curve and derived parameters (D10, D30, D60, Cu, Cc) are reported in accordance with ASTM D2487 for USCS classification. More info.